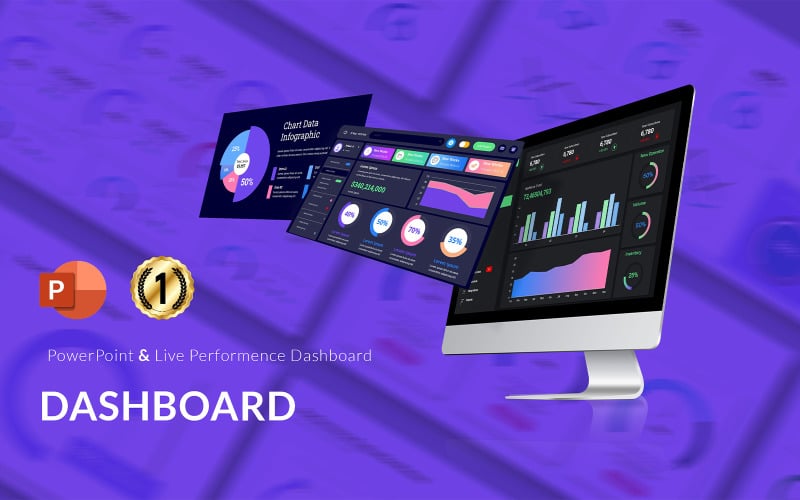
Live dashboard Performance Template

6 months of support With a product you will get 6 months of support from the author. To know more about what is included, please read the support policy.

shoppingBag Sales: 0

Live dashboard Performance Template

Created: Nov 6, 2024

Updated: Nov 6, 2024

ID: 465018

Live dashboard Performance Template - Features Image 1Live dashboard Performance Template - Features Image 2Live dashboard Performance Template - Features Image 3Live dashboard Performance Template - Features Image 4Live dashboard Performance Template - Features Image 5Live dashboard Performance Template - Features Image 6Live dashboard Performance Template - Features Image 7Live dashboard Performance Template - Features Image 8Live dashboard Performance Template - Features Image 9Live dashboard Performance Template - Features Image 10Live dashboard Performance Template - Features Image 11Live dashboard Performance Template - Features Image 12Live dashboard Performance Template - Features Image 13Live dashboard Performance Template - Features Image 14Live dashboard Performance Template - Features Image 15Live dashboard Performance Template - Features Image 16Live dashboard Performance Template - Features Image 17Live dashboard Performance Template - Features Image 18

What is a live dashboard?

A live dashboard displays metrics and data visualizations in real-time. This enables teams and decision makers to react to changes in status and performance as quickly as possible.

Live KPI dashboards are particularly useful in situations where important metrics are otherwise difficult to access, or when the team’s attention is focused on more immediate tasks. For example, many call centers display live dashboards on a TV on the wall. This allows the team to immediately see when something has changed (such as a build up of callers) and respond. Without a live dashboard, it would be impractical to access this information.

A live dashboard can surface metrics from multiple data sources, and display them side by side. This presents the opportunity to visualize only the most important metrics, necessary for managing a specific system or process.

  • PowerPoint Template (PPTX)
  • 4+ Theme color option
  • Unlimited colors change Option
  • 16×9 FULL HD Ratio (1920×1080px)
  • Easy and Fully Editable in PowerPoint presentation
  • Image Also include
  • Print Ready
  • 3 color variation
  • Size:(30×70Inches) with bleed (1 inche)
  • Image is included
  • free font use

0 Reviews for this product

0 Comments for this product
About Author

Enthusiast Author

Achievements

Images included:

Yes

Requirements for software and hosting:

PowerPoint 2003 or 2007 (better) PowerPoint 2003 or 2007 (better)
Powerpoint 2007 (recommended) or Powerpoint 2003